
Why Candlestick Patterns Matter
Candlestick charts are one of the most effective ways to analyze forex price action. Each candlestick shows the opening, closing, high, and low price for a given period. Patterns formed by candlesticks often signal potential market moves.
Learning these patterns helps you spot reversals, continuations, and entry opportunities.
1. Doji
- Description: Open and close prices are nearly equal, forming a cross-like candle.
- Signal: Market indecision. May indicate a trend reversal if seen at the top or bottom of a trend.
2. Hammer
- Description: Small body at the top, long lower shadow, little or no upper shadow.
- Signal: Bullish reversal when found after a downtrend. Buyers are stepping in.
3. Inverted Hammer
- Description: Small body at the bottom, long upper shadow.
- Signal: Possible bullish reversal, but needs confirmation with the next candle.
4. Shooting Star
- Description: Opposite of hammer. Small body at the bottom with a long upper shadow.
- Signal: Bearish reversal when seen after an uptrend.
5. Bullish Engulfing
- Description: Small bearish candle followed by a large bullish candle that engulfs the first.
- Signal: Strong bullish reversal.
6. Bearish Engulfing
- Description: Small bullish candle followed by a larger bearish candle.
- Signal: Strong bearish reversal.
7. Morning Star
- Description: A three-candle pattern. First a bearish candle, then a small indecisive candle, followed by a strong bullish candle.
- Signal: Bullish reversal after a downtrend.
8. Evening Star
- Description: Opposite of morning star. Bearish candle comes last.
- Signal: Bearish reversal after an uptrend.
9. Three White Soldiers
- Description: Three consecutive bullish candles with higher closes.
- Signal: Strong bullish continuation.
10. Three Black Crows
- Description: Three consecutive bearish candles with lower closes.
- Signal: Strong bearish continuation.
How to Use Candlestick Patterns Effectively
- Always confirm with technical indicators (RSI, MACD, moving averages).
- Look for patterns at support and resistance levels.
- Use higher timeframes (H1, H4, Daily) for stronger signals.
- Avoid trading on patterns alone. Combine with risk management.
Example in Action
Imagine EUR/USD is in a strong downtrend. A hammer candlestick forms at a support level. If the next candle confirms with a bullish close, it may be an entry signal for a buy position with a stop-loss below support.
Final Thoughts
Candlestick patterns give you powerful insights into market psychology. Learn these 10, combine them with other tools, and you will improve your decision-making in forex trading.
Call to Action:
Open a demo account with a trusted broker and practice spotting these candlestick patterns on live charts.
Related Posts
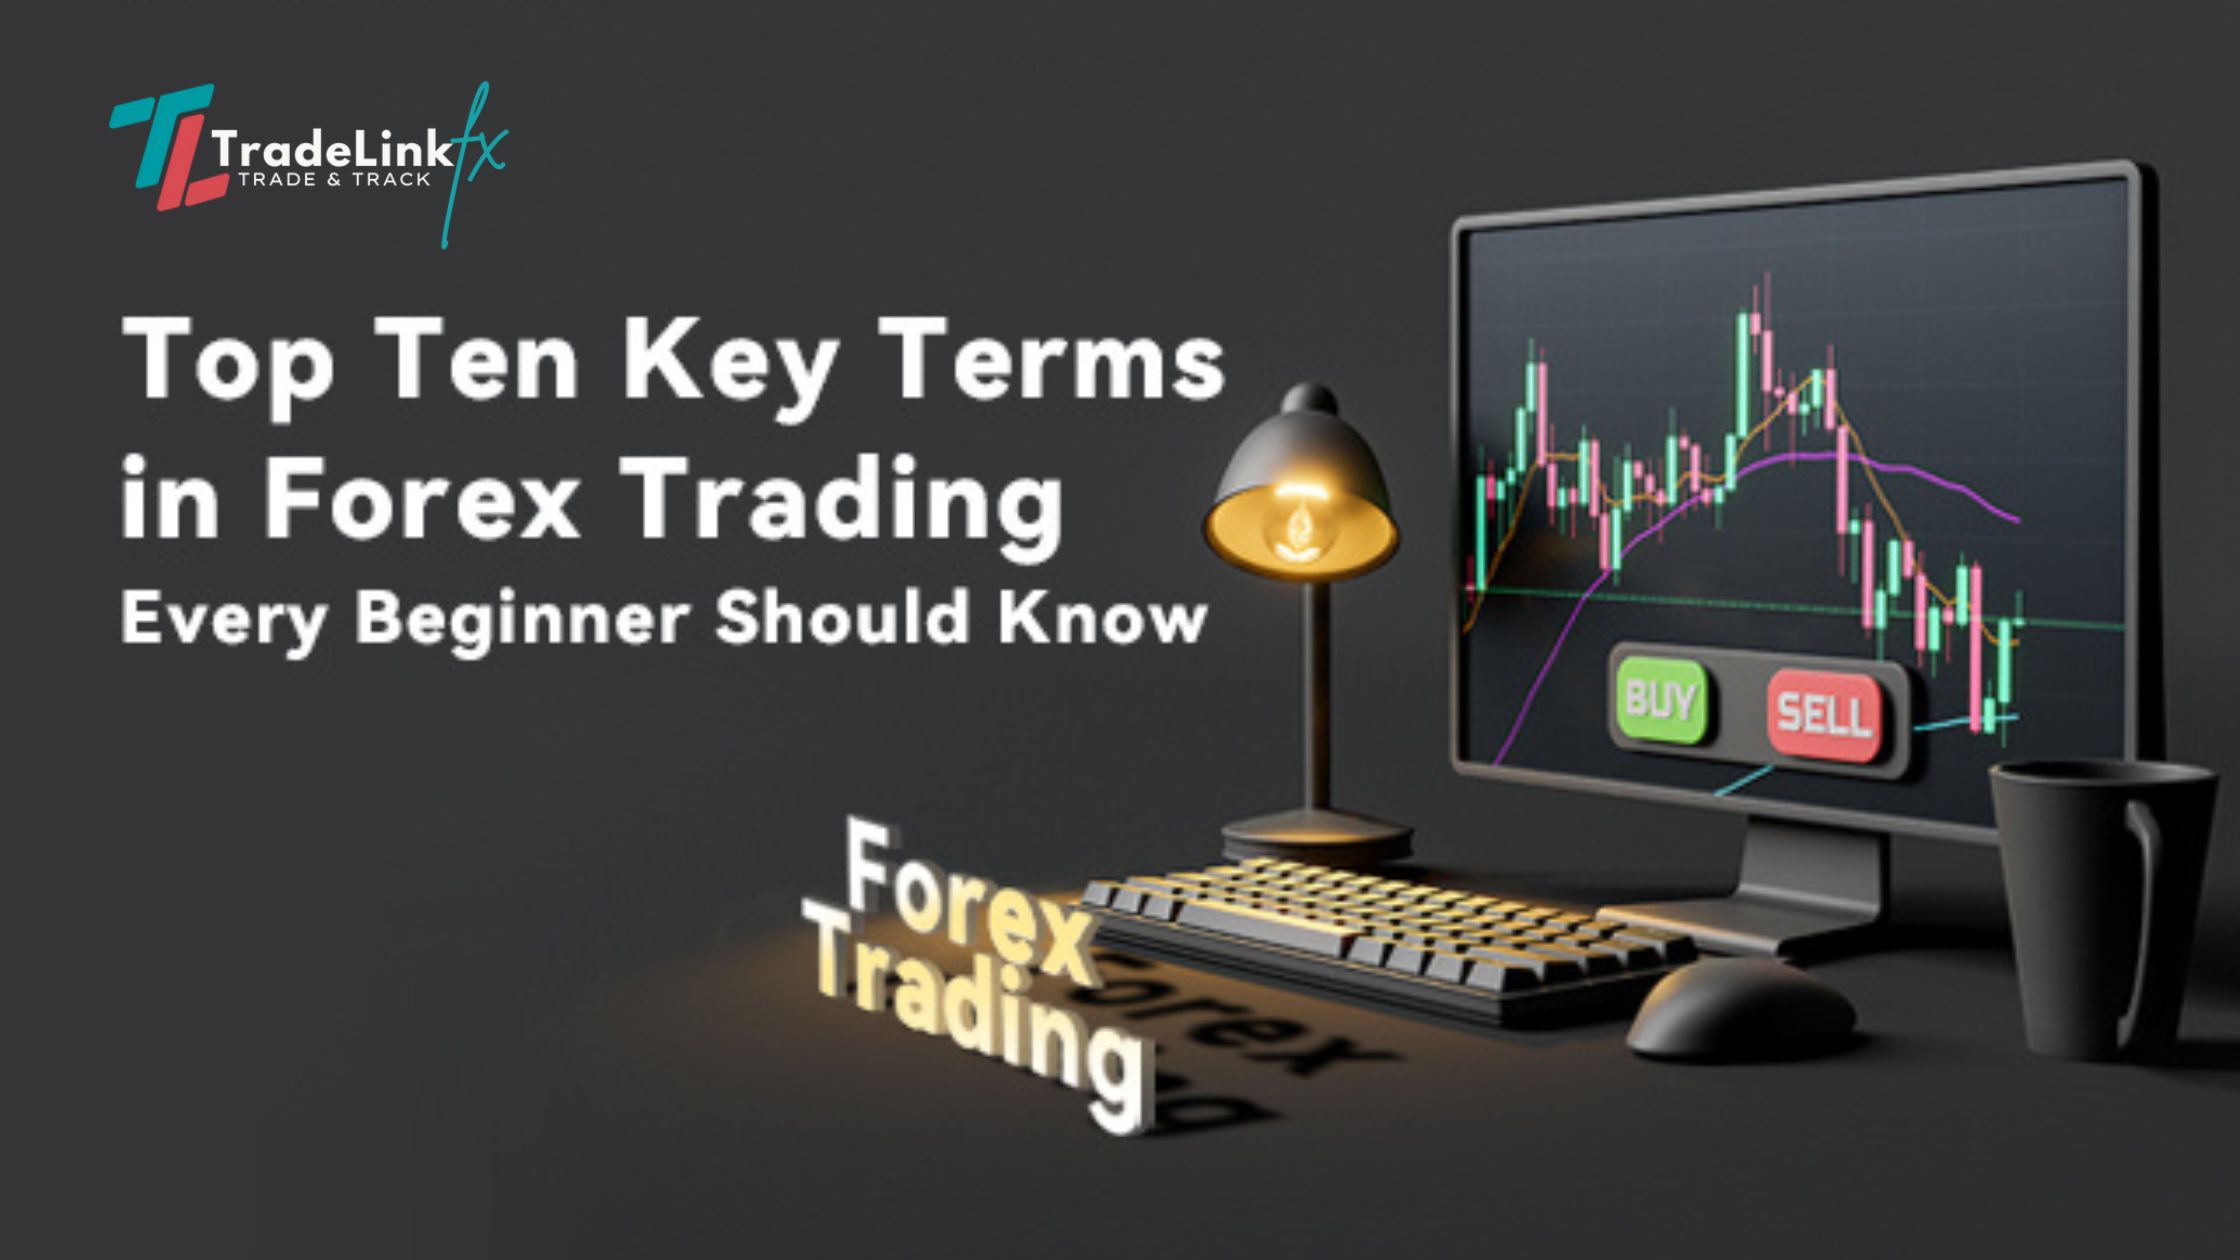
Top 10 Forex Trading Terms Every Beginner Must Know
If you’re new to Forex trading, the jargon can feel…

What is Forex Trading? A Complete Beginner’s Guide
Forex Trading 🌍 How Does Forex Trading Work? At its…
Beginner’s Guide to Forex Trading: How to Start Safely
What is Forex Trading? The foreign exchange market, or forex,…